

Reverse DCF Model - Valuing a Company
How to Value a Comapny

Hi Readers!
Welcome back to Steady Investing, where we simplify the stock market by breaking down complex financial concepts into clear, easy-to-understand insights.
Today, let’s explore Reverse DCF, a handy tool to understand how a company is valued at its current price and what growth assumptions the market is already expecting. We’ll break it down with a simple example using Google to make it clear.
In this article, I’ll explain everything you need to know about a Reverse DCF.
What is the value of every asset?
All future cash flows will be generated for you as an investor (discounted to today).
Note: After reading this article, check out the entire series on “How to Analyze and Value a Company”. This provides a complete picture of how to evaluate a company
What’s the key to successful investing?
Keep it simple!
If you need a complex Excel model to decide if a stock is worth buying, it’s probably not.
On Wall Street, analysts try to pin down a company’s value to two decimal places. That kind of precision is misleading and often useless. Why? Because every valuation depends on assumptions, and the more assumptions you make, the more room there is for error.
Don’t just take my word for it:
“Some of the worst business decisions I’ve seen came with detailed analysis. The higher math was false precision.”
— Charlie Munger
So, how should you value a company?
Let’s explore a simpler, more reliable approach.
What Is Reverse DCF?
A traditional DCF (Discounted Cash Flow) estimates a company’s value by forecasting its future cash flows and discounting them back to the present. The problem? It relies on many assumptions; the more you make, the less reliable the outcome.
A Reverse DCF flips the script. Instead of projecting future cash flows, it starts with the current stock price and works backward to reveal the growth expectations baked into that price.
Think of it like solving a puzzle: you already know the final picture (the stock price), and your job is to uncover the missing pieces, what kind of growth the market is expecting.
Why Use Reverse DCF?
Reverse DCF helps you see if the market’s expectations for a company are realistic. If the stock price assumes crazy growth that’s unlikely, the stock might be overvalued. If the assumptions seem reasonable or low, it could be a bargain. It’s a great way to double-check if a stock’s price makes sense.
How to Do a Reverse DCF (Simplified)
Here’s a step-by-step approach using Google as an example. We’ll keep it simple for beginners. To perform Reverse DCF, you only need 3 things:
The current stock price of the company (In sheets, automated using ticker symbol)
The number of shares outstanding (automated)
The Free Cash Flow in Year 1 (pull this info from FinChat or Yahoo)
I created a simple template you can use:
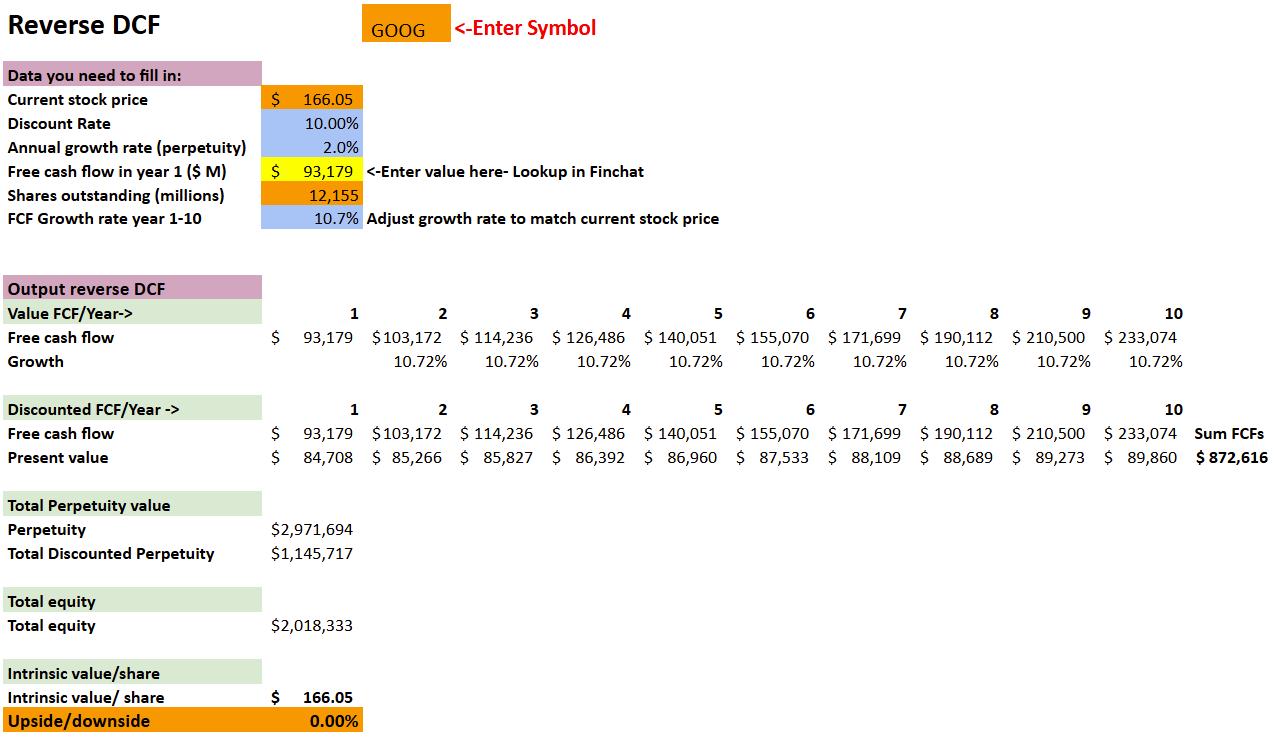
What does this mean?
This means that at the current stock price of $166.05, Google needs to grow its Free Cash Flow (FCF) at 10.7% for the next 10 years to return 10% (discount rate in the above table) for you as a shareholder.
Let’s understand what each of those highlighted cells means:
Current Stock Price: Enter the Ticker Symbol in the box showing “Enter Symbol”, which will populate the stock price automatically.
Discount Rate: This is important; this is the opportunity cost for you as an investor. What is the minimum return you would like to expect from your investment? Anything below that return you would rather invest in the 2nd best option.
For me, the opportunity cost is the S&P 500 Index, which returns a 10% annual return on average over the long term.
Adjust this number based on your minimum required return
Annual growth rate - Perpetuity: This is the growth rate of the company from year 11 to the end of time. I chose 2%, which is the average US GDP growth rate.
If you put anything over the GDP growth rate, you are essentially saying that the company will be bigger than the country’s GDP at some point. Which is not possible.
FCF Year 1: This is not straightforward; we need to make a couple of adjustments
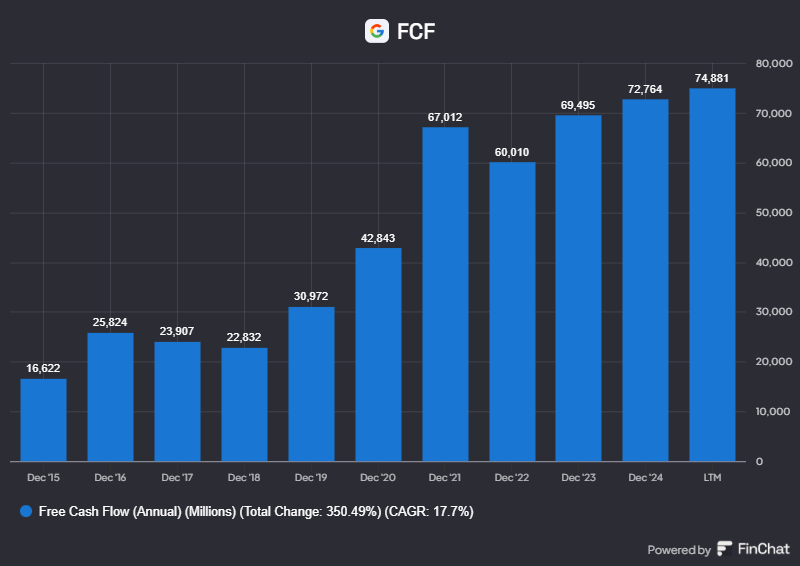
First step, get Free Cash from Google from Finchat:
Once you open the company in Finchat,
Go to the “Financials” tab
Then type in “Free Cash Flow” in the “Select & Search Metrics” bar

FCF for Google is $74,881 M
Now, we need to make two adjustments to Google’s Free Cash Flow:
We subtract Stock-Based Compensation as it’s a cost for shareholders
We add Growth CAPEX
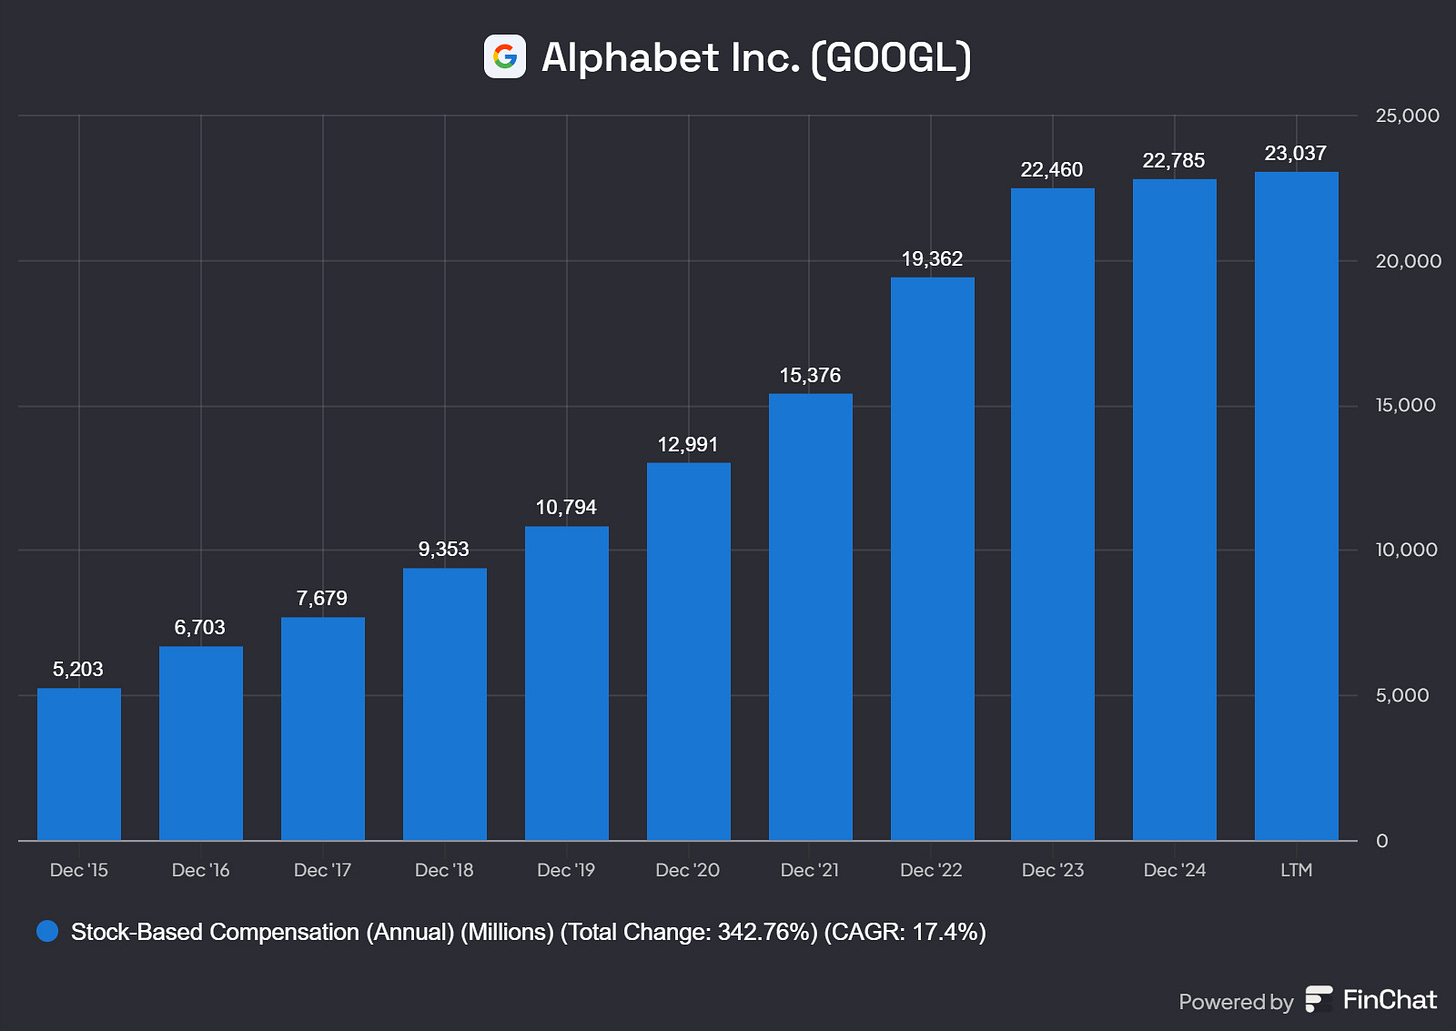
Stock-Based Compensation (SBC):
Search for SBC, same as above in Finchat
SBC for Google is 23,037
CAPEX = Maintenance CAPEX + Growth CAPEX
Understanding Maintenance vs. Growth Capex
Not all capital expenditures (Capex) are created equal. It’s helpful to separate them into two categories:
Maintenance Capex: These are investments to keep existing operations running smoothly — replacing worn-out equipment, maintaining facilities, or updating current systems.
Growth Capex: These are investments aimed at expanding the business, opening new stores, launching new products, or entering new markets.
When a company is focused on future growth, its Growth Capex will often be significantly higher. While this may reduce short-term profits, these investments can generate substantial long-term value if executed well.
A common rule of thumb:
Maintenance Capex ≈ Depreciation & Amortization, since both relate to the wear and tear of existing assets.

Growth CAPEX = Total CAPEX - Depreciation & Amortization
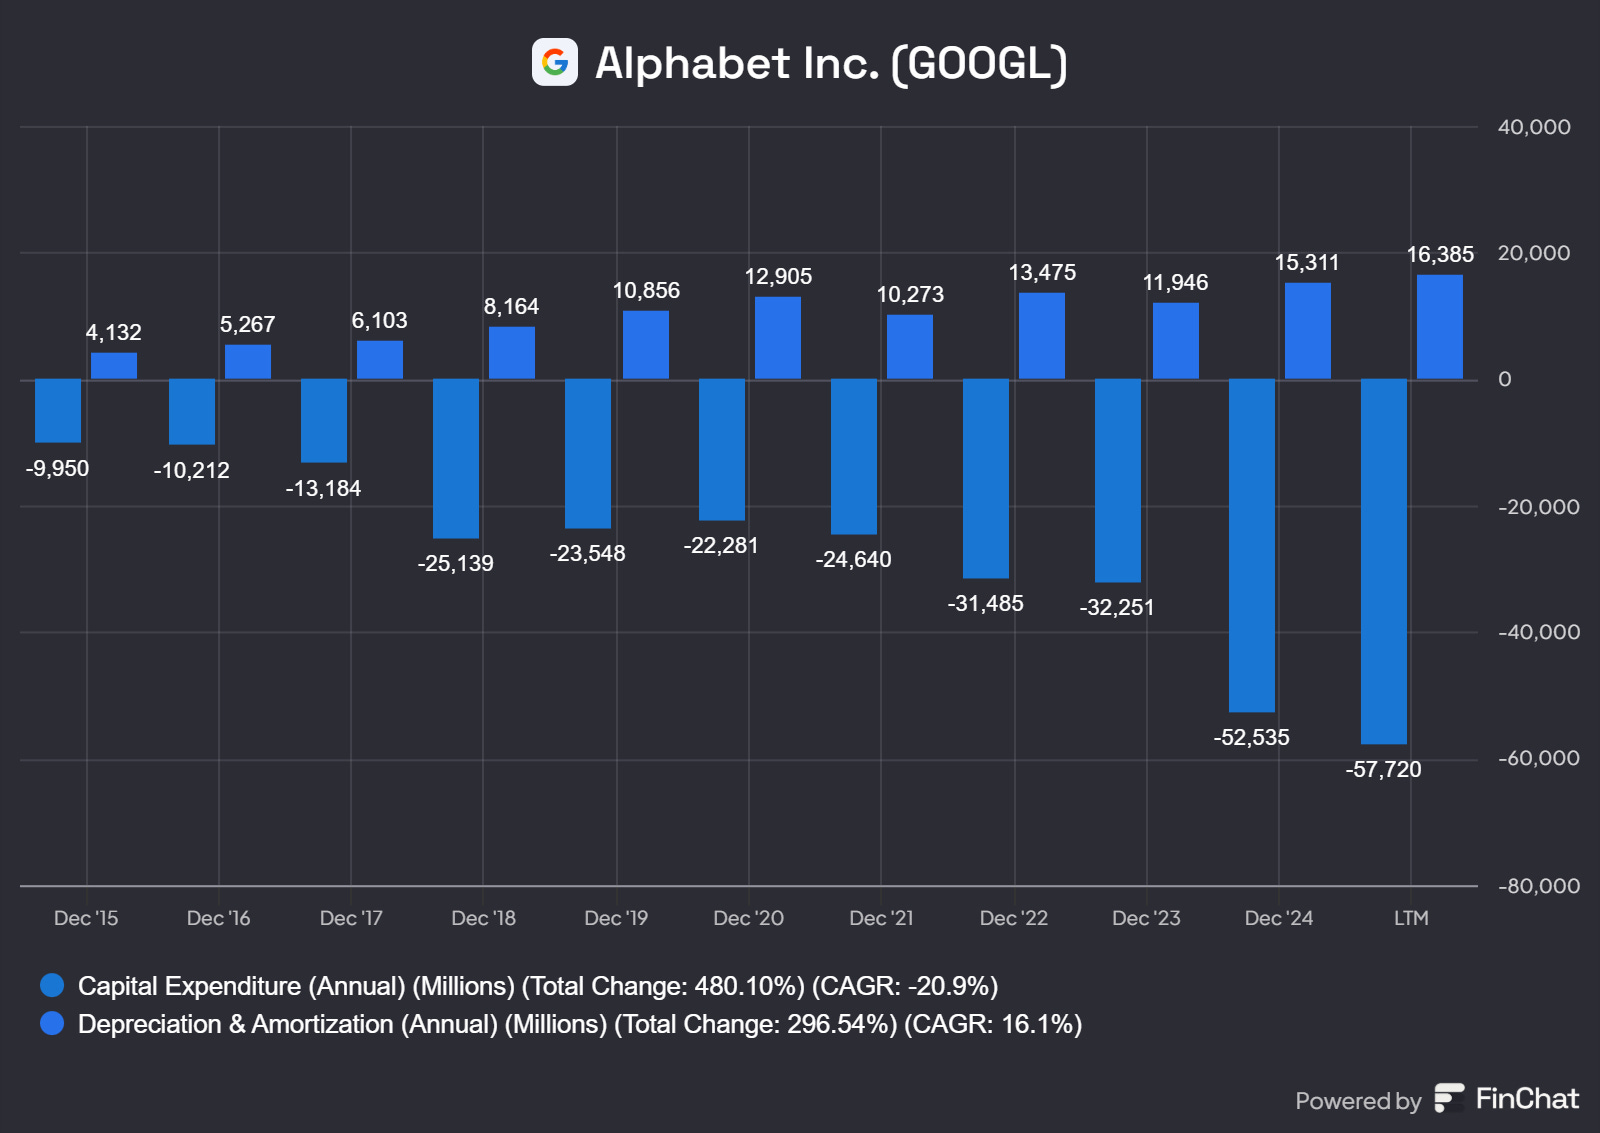
Growth CAPEX = $57,720 - $16,385 = $41,335
Free Cash Flow 74881-23037+41335 = $93,179 M
Why add Growth CAPEX back?
Because the company can choose not to invest in growth and return to the shareholders.
Shares Outstanding: This is automated based on input on the Ticker Symbol
FCF growth rate from Year 1 -10: Adjust this growth rate, till you see the last row in the sheet “Upside/Downside” becomes 0%.

Is Google overvalued or undervalued?
Now we determine whether Google is overvalued or undervalued.
Expectations implied in the current stock price (Reverse DCF): 10.7%
Google should grow its FCF by 16.6% per year to generate a return of 10% per year for you as an investor
Is this realistic?
Google has grown its FCF by 17.6% per year over the past 10 years
Analysts expect Google to grow its FCF by 15% per year in the years ahead.
As you can see, what is implied in the current stock price (Reverse DCF) is less than what we expect from Google in the years ahead.
As a result, Google looks Undervalued today.
That’s it for today!
Conclusion:
Reverse DCF is one of the most practical tools to assess a company’s valuation.
Keep it simple, you don’t need complex formulas to estimate a business’s fair value.
This method helps you uncover the growth expectations already priced into the stock. Compare these implied growth rates with your assumptions to judge if the stock is overvalued or undervalued.
To make this easier, I’ve included an Excel template you can download and use to analyze the growth baked into the prices of companies in your portfolio.
Important: Don’t rely solely on a Reverse DCF to make investment decisions. Use it as one of several tools in your analysis. For a more complete picture, refer to the checklist in my post “How to Analyze a Company” to evaluate the business holistically.
About Me
I am a self-taught investor who has read hundreds of books on investing and spends 40+ hours a week researching and analyzing stocks. Steady Investing has a true passion for investing and helping other investors.
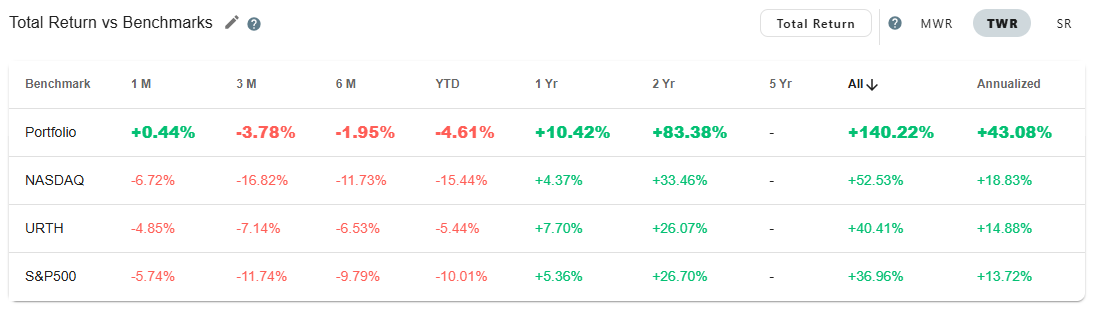
I did not come from a finance background, and it took me nearly 10 years from learning about the stock market to finally making my first investment. Since 2022, when I started tracking my performance, I have outperformed the S&P 500 by over 100%—up 140% vs. 37% for the S&P 500 index, with an annualized return of over 43% (inception date Nov’22).
I created this platform to share my investing journey and help others navigate the stock market with confidence.
Let’s grow together. 🚀
Visit my page to access previous posts.
Disclaimer: This post is for educational purposes only and should not be considered financial advice. Always do your research before making investment decisions.

Great article! In my opinion, reverse DCF is a method that's used not often enough by investors. Most of them prefer using "regular" DCF, without really understanding the consequences and assumptions that underly this model.
If I could give you one tip, Excel provides a "Solver" (link to setup guide: https://support.microsoft.com/en-us/office/define-and-solve-a-problem-by-using-solver-5d1a388f-079d-43ac-a7eb-f63e45925040).
This Solver allows you to calculate the implied growth rate immediately, rather than adjusting it manually to equal the current stock price, so it might save you some time!
Great article. In my opinion adding back growth capex is something that i Will do but with a grain of salt and just to give me a pulse of it, because using depreciation as a proxy for Maintenance capex is in some manner a estimation with a large probability of error, i think the pool of companies that overestimate the depreciation schedule is huge, because they dont count with the rapid advance in Technology, and the rise of inflation. In than is the question of the capitalized portion of intangibles, like R&D and SG&A. I prefer to leave the capitalized investments of the equation and have a more conservative aproach