


Analyzing Growth, Profitability & Balance Sheet - Company's Report Card
Quantitative analysis of Moat

Hi Partners!
Welcome back to our Substack series on becoming a smarter investor! We’ve already covered ROIC, business models, management & moats.
Today, we’re diving into three key pillars that tell you if a company is thriving: growth, profitability, and balance sheet health. These metrics are like a report card for a business, showing whether it’s growing steadily, making good money, and staying financially safe. These metrics will provide quantitative analysis for Moat analysis, and determine whether a company can increase its revenues & Margins in the long term. I’ll break this down in simple terms, share the specific numbers I look for, and use examples from companies like Microsoft and Ford to clarify it.

If you missed the previous post in this series, check it out:
Analyzing Moat - Does the Company have a Competitive Advantage?
Management Analysis - The Ultimate Edge in Long-Term Investing
How to analyze a company - this provides high-level steps to analyze a company like a pro investor
Next in this series:
Future Growth & Valuation
Don’t forget to subscribe so you don’t miss the rest of this deep-dive series.
Each topic is designed to give you practical tools and knowledge to analyze businesses like a pro.
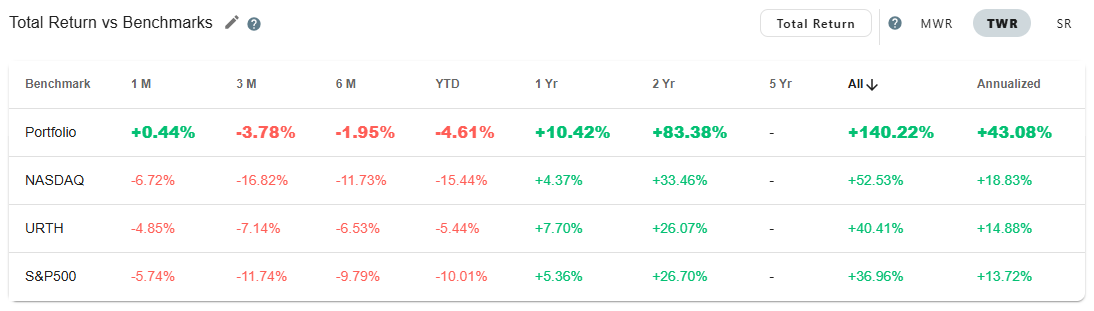
Following a consistent process and checklist has helped Steady Investing's portfolio (as of 4/21/2025) outperform the S&P 500 by over 100% - up 140% vs. 37% for the S&P 500 index, with an annualized return of over 43% (inception date Nov’22).
Let’s get started!
Step 1: Growth—Is the Company Getting Bigger?
Growth is all about whether a company is making more money each year. Think of it like a lemonade stand: if you sold $100 worth of lemonade last summer and $120 this summer, your sales grew by 20%. That’s a good sign! For companies, I look at revenue growth (total sales) and earnings growth (profits after expenses). A healthy company should grow by at least 5–10% annually, showing it’s attracting more customers or selling more products. Key Metrics I look for:
Revenue Growth past 5 years (CAGR) > 7%
Revenue Growth past 10 years (CAGR) > 5%
Example: Microsoft
Microsoft has been a growth star. In 2024, its revenue was $245 billion, up 15% from $211 billion in 2023. Its earnings (net income) grew 20%, from $72 billion to $86 billion. Why? Microsoft has been continuously innovating and providing new products and services to customers, such as cloud business, Azure, as more companies move online, and its software, like Windows and Office, keeps customers coming back. Steady double-digit growth like this shows Microsoft is on the right track.
Revenue Growth past 5 years (CAGR) = 14.3% ✅
Revenue Growth past 10 years (CAGR) = 10.9% ✅
Red Flag Example: Ford
Contrast that with Ford. In 2024, Ford’s revenue was $180 billion, up just 2% from $176 billion in 2023. Its earnings dropped 10%, from $4.3 billion to $3.9 billion, due to high costs in its electric vehicle (EV) push and supply chain issues. Slow growth like this makes me cautious—Ford isn’t expanding as fast as I’d like, and shrinking profits are a warning sign.
Why It Matters: Growth shows a company isn’t standing still. But growth alone isn’t enough—it needs to be profitable, or it’s just burning cash to get bigger.
Revenue Growth past 5 years (CAGR) = 3.5% ❌
Revenue Growth past 10 years (CAGR) = 2.5% ❌
Step 2: Profitability—Is the Company Making Good Money?
Profitability tells you how much money a company keeps after paying its bills. It’s like checking if your lemonade stand makes enough to cover lemons, sugar, and cups—and still leaves you with pocket money. I look at five key metrics to gauge profitability, and I want them to be high because that means the company is efficient and can reinvest in growth or pay shareholders.
My Profitability Checklist
Gross Margin > 40%: This is the money left after paying for the “stuff” to make a product (like lemons for lemonade). A high gross margin means the company can charge more than it costs to make its goods.
Net Profit Margin > 10%: This is the money left after all expenses—production, salaries, taxes, everything. A high net margin means the company keeps a good chunk of its sales as profit.
Free Cash Flow Margin > 10%: Free cash flow (FCF) is the cash left after paying for operations and investments (like buying a new lemonade stand). A high FCF margin means the company has cash to grow, pay debts, or return to shareholders.
Microsoft: A Profitability Powerhouse
Let’s see how Microsoft stacks up in 2024:
Gross Margin: Microsoft’s gross margin is 70% ✅. It earned $245 billion in revenue and spent $75 billion on production (like servers for Azure), leaving $170 billion. That’s way above my 40% target—Microsoft can charge premium prices for its software and cloud services.
Net Profit Margin: Microsoft’s net income was $86 billion on $245 billion in revenue, a 35% net margin ✅. That’s excellent, well above my 10% goal, showing Microsoft keeps a lot of its sales as profit.
Free Cash Flow Margin: Microsoft generated $74 billion in free cash flow. That’s a 30% FCF margin ($74B/$245B) ✅, far exceeding my 10% threshold. It has plenty of cash to innovate or pay dividends.
Microsoft nails every profitability metric, showing it’s efficient, profitable, and cash-rich—a dream for investors.
Ford: A Mixed Picture
Now let’s look at Ford in 2024:
Gross Margin: Ford’s gross margin is 9% ❌. It earned $180 billion in revenue and spent $153 billion on production (like car parts), leaving $27 billion. That’s well below my 40% target—cars are capital-intensive, and Ford can’t charge as much of a premium as Microsoft does.
Net Profit Margin: Ford’s net income was $3.9 billion on $180 billion in revenue, a 2% net margin ❌. That’s far below my 10% goal, showing Ford struggles to keep much profit after expenses.
Free Cash Flow Margin: Ford generated $6 billion in free cash flow, a 3% FCF margin ($6B/$180B) ❌. That’s below my 10% target, meaning Ford doesn’t have much cash left after its heavy investments in EVs.
Ford’s profitability is weak—low margins and limited cash flow make it less attractive than Microsoft. It’s struggling to turn sales into profits, especially with its costly EV transition.
Step 3: Balance Sheet Health: Is the Company Financially Safe?
A healthy balance sheet is like a strong safety net—it ensures a company can weather tough times without going broke. I’ve already touched on two balance sheet metrics in my profitability checklist: interest coverage (can it pay its debt interest?) and net debt/FCF (can it pay off its debt?). But let’s look at a few more signs of a healthy balance sheet:
Cash on Hand: Does the company have enough cash to cover emergencies?
Debt Levels: Is its debt manageable compared to its earnings?
Current Ratio > 1: This is current assets (like cash and inventory) divided by current liabilities (bills due within a year). A ratio above 1 means the company can pay its short-term bills.
Interest Coverage > 15x: This measures if a company can easily pay the interest on its debt. If it earns $15 for every $1 of interest, it’s safe (15x coverage).
Net Debt/FCF < 4: Net debt is total debt minus cash. If it’s less than 4 times the free cash flow, the company can pay off its debt in a reasonable time (under 4 years).
Microsoft’s Balance Sheet: Microsoft has $60 billion in cash, enough to cover any crisis. Its total debt is $80 billion, but with $105 billion in operating income, it’s easily manageable. Its current ratio is 1.5, meaning it can pay its short-term bills with room to spare. Microsoft’s balance sheet is rock-solid.
Interest Coverage: Microsoft’s operating income (profit before interest and taxes) was $105 billion, and its interest expense was $2.5 billion. That’s 42x coverage ($105B/$2.5B) ✅, way above my 15x target—Microsoft easily handles its debt payments.
Net Debt/FCF: Microsoft has $20 billion in net debt (total debt of $80B minus $60B in cash). With $74 billion in FCF, its net debt/FCF ratio is 0.27 ($20B/$74B) ✅, well below my limit of 4. It could pay off its debt in just a few months!
Ford’s Balance Sheet: Ford has $70 billion in cash, which is decent, but its $100 billion in debt is high compared to its $10 billion operating income. Its current ratio is 1.2, which is okay but not great. Ford’s balance sheet is stable, but stretched; those high debt levels and low interest coverage make me nervous.
Interest Coverage: Ford’s operating income was $10 billion, and its interest expense was $1.2 billion. That’s 8.3x coverage ($10B/$1.2B) ❌, below my 15x goal. Ford can pay its interest, but it’s not as comfortable as I’d like.
Net Debt/FCF: Ford has $30 billion in net debt (total debt of $100B minus $70B in cash). With $6 billion in FCF, its net debt/FCF ratio is 5 ($30B/$6B) ❌, above my limit of 4. It would take Ford 5 years to pay off its debt, which is a bit risky.
Why This Matters to You
Growth, profitability, and balance sheet health are the trifecta of a great investment. A company like Microsoft, with strong growth (15% revenue increase), excellent profitability (70% gross margin, 35% net margin), and a healthy balance sheet ($60B in cash, low debt), is a winner—it’s growing, making money, and staying safe. Ford, with slow growth (2% revenue increase), weak profitability (2% net margin), and a stretched balance sheet (net debt/FCF of 5), is riskier—it’s struggling to grow profitably and could stumble if times get tough.
How to Check These Metrics Yourself
Want to analyze a company? Here’s how to find these numbers:
All the numbers I provided are readily available on websites like Finchat or Yahoo. You can also look at the 10K statements.
Once you find a company that matches your criteria, then I would open up the 10-K and analyze it. This article may help you: How to analyze an Annual Report (10-K)
Growth: Check revenue and earnings in the company’s annual report (look for the income statement). Also, look for guidance for future growth that management provides.
Profitability: Gross margin, net margin are in the 10K statements, but FCF is not readily available in the annual report. It can be calculated (FCF = operating cash flow minus capital expenditures).
Balance Sheet: Find cash, debt in the balance sheet section of the annual report. You can calculate the rest:
Current ratio = Current assets/ Current liabilities
Interest coverage EBIT/ Interest Expense and
Net debt/FCF - use the balance sheet to get the debt and FCF calculated in the profitability section.
Pick a company you’re curious about, pull these numbers, and compare them to my benchmarks. You’ll quickly see if it’s a star like Microsoft or a riskier bet like Ford.
That’s it for today! Hope you enjoyed it!
About Me
I am a self-taught investor who has read hundreds of books on investing and spends 40+ hours a week researching and analyzing stocks. Steady Investing has a true passion for investing and helping other investors.
I did not come from a finance background, and it took me nearly 10 years from first learning about the stock market to finally making my first investment. Since 2022, when I started tracking my performance, I have outperformed the S&P 500 by over 100% - up 140% vs. 37% for the S&P 500 index with an annualized return of over 43% (inception date Nov’22).
I created this platform to share my investing journey and help others navigate the stock market with confidence.
Let’s grow together. 🚀
Visit my page to access previous posts.
Disclaimer: This post is for educational purposes only and should not be considered financial advice. Always do your research before making investment decisions.