


How to Analyze Balance Sheet
Analyze like a professional!

Source: Napkin Finance
The Balance Sheet provides a clear view into companies financial health. Every Investor must know how to analyze a balance sheet before investing.
For this exercise, I will continue to use Old Dominion Freight Line’s (ODFL) balance sheet to explain.
It's crucial to understand that the balance sheet provides a snapshot of a company's financial health at a specific point in time. For example, if a company's fiscal year ends on December 31, 2024, the balance sheet in its annual report (10-K) will reflect its financial position as of that exact date.
Balance Sheet= Snapshot at a certain point in time
Income & Cash Flow Statements = for a period of time (3 months in 10-Q & 12 month period in 10-K reports)
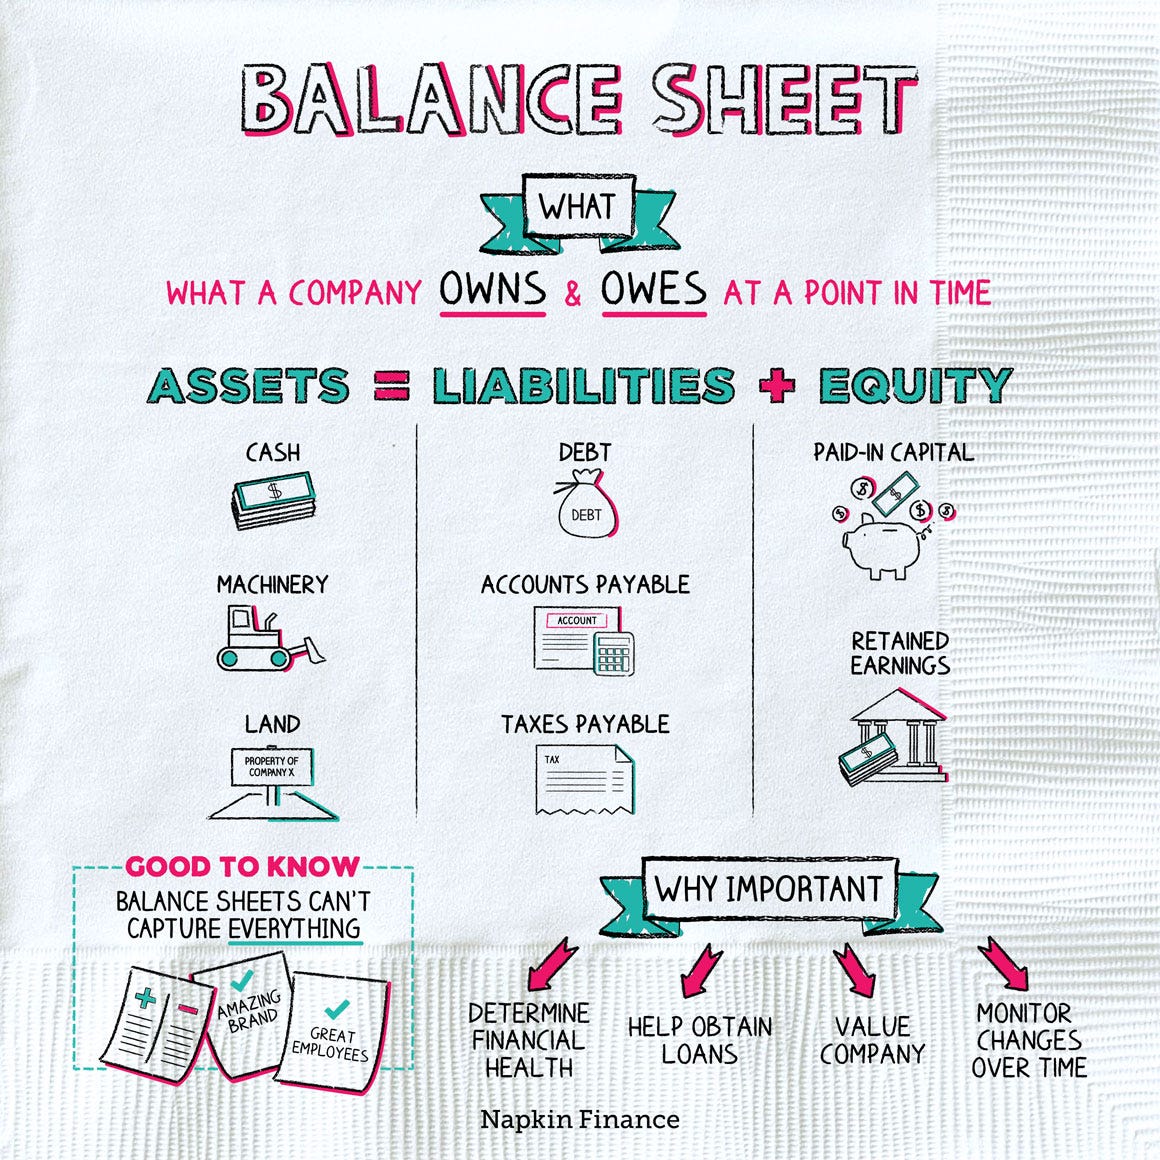
What is a Balance Sheet?
A balance Sheet of a company always provides a snapshot of 3 things about a company at a specific point in time:
Assets
Liabilities
Shareholders Equity

The balance sheet displays the company’s total assets and how the assets are financed, either through either debt or equity. It can also be referred to as a statement of net worth or a statement of financial position. The balance sheet is based on the fundamental equation:
Assets = Liabilities + Equity

Assets

Similar to our personal Finances, For companies, Assets show us everything the company owns.
As you see in the above picture, Assets are separated by current & non-current Assets.
Current Assets: Assets that can be converted into cash within one year.
Examples: Cash and cash equivalents, short-term investments, accounts receivable, and inventories.Non-Current Assets: Assets that are more difficult to convert into cash and are typically held for the long term.
Examples: Buildings, stores, goodwill (premium paid for acquisitions), and patents.
A company's assets are always listed in order of liquidity, from the most liquid (cash) to the least liquid (long-term assets).

Assets will provide you with information on the following:
How much Cash and Cash equivalents does the company have and do they have enough to pay short-term debt
Is the Inventory going up/down? Is it management’s decision or are they losing market power or something else?
Does the company have a lot of intangible assets such as Goodwill or patents?
Liabilities

Liabilities represent what a company owes to others. They are categorized into short-term and long-term liabilities based on their repayment timeline.
Short-Term Liabilities: Financial obligations that must be paid within one year.
Examples: Short-term debt, accounts payable, and accrued expenses.Long-Term Liabilities: Debts and obligations that extend beyond one year.
Examples: Long-term debt, pension obligations, and lease liabilities.
While some debt is normal, excessive debt can be risky, so it's crucial to evaluate a company’s financial health before investing.
For ODFL, you can see that they have plenty of cash & receivables to cover the short-term debt.
Similar to Assets, Liabilities are listed from most liquid to least liquid:
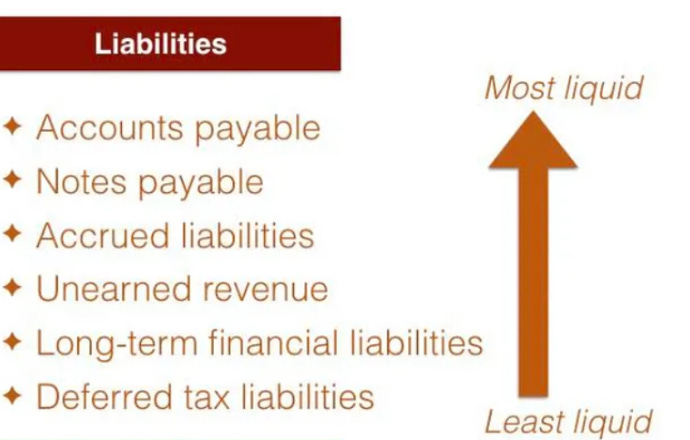
Liabilities will provide you with information on the following:
Does the company have excess short-term liabilities and can they make the payments on time?
Is the company’s debt reducing over time?
How much “current maturities of long-term debt” are due now and in the next periods (this can be found in the footnotes of 10-K)?
Shareholders Equity
The shareholder’s equity is the net (assets-liabilities) money that the owners (shareholders) have in the company.
Shareholders equity = Total assets - Total liabilities
It is typically divided into two main categories:
Contributed Capital – The amount shareholders have invested in the company in exchange for ownership (common stock and additional paid-in capital).
Retained Earnings – Profits the company has chosen to reinvest in the business rather than distribute as dividends.
Shareholders' equity is a key indicator of a company's financial strength and long-term sustainability.
Conclusion:
That is all for today. A few things to remember:
The balance sheet provides a snapshot of the financial health of the company
Make sure the company has enough cash and cash equivalents to cover its short-term debt.
Ratio that helps- Interest coverage: (EBIT / Interest payments)
Making sure liabilities are not growing at excess rates compared to the assets.
In case you missed my previous post in this series “How to analyze Annual Statements” here are the links:
About Me:
I am a self-taught investor who has read hundreds of books on investing and spends 40+ hours a week researching and analyzing stocks.
I did not come from a finance background, and it took me nearly 10 years from first learning about the stock market to finally making my first investment. Since tracking my performance, I have achieved a 40% compound annual growth rate (CAGR).
I created this platform to share my investing journey and help others navigate the stock market with confidence.
Let’s grow together. 🚀
Visit my page to access previous posts.
Disclaimer: This post is for educational purposes only and should not be considered financial advice. Always do your research before making investment decisions.
Thanks for this. Helpful.
Love how you make these things so clear and easy to understand! I think this would also work great in a video format.