


How to Analyze an Income Statement
Everything you need to know about it!

Before we dive into the income statement, I want to share that it is also referred to by several other names:
Profit & Loss Statement (P&L)
Statement of Earnings
Statement of Operations
Statement of Income
Earnings Statement
Consolidated Statement of Income
Statement of Comprehensive Income
Companies use different names for Income Statements in their annual reports.
What is an Income Statement?
The income statement is a fundamental financial statement that provides an overview of a business’s revenues, expenses, gains, and losses over a specific period of time. Companies provide these statements on a Quaterly (10-Q) & Annually (10-K).
Knowing how to analyze an income statement is necessary to make good investment decisions. As an investor, we need to look for profitable companies with high margins.
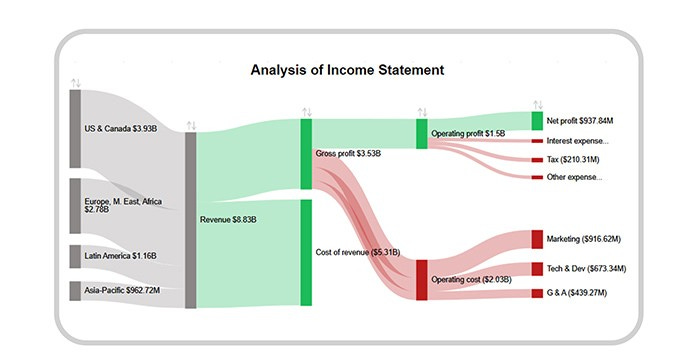
I will walk through step by step on how we go from Revenue (top line) to Net Income (Bottom line)
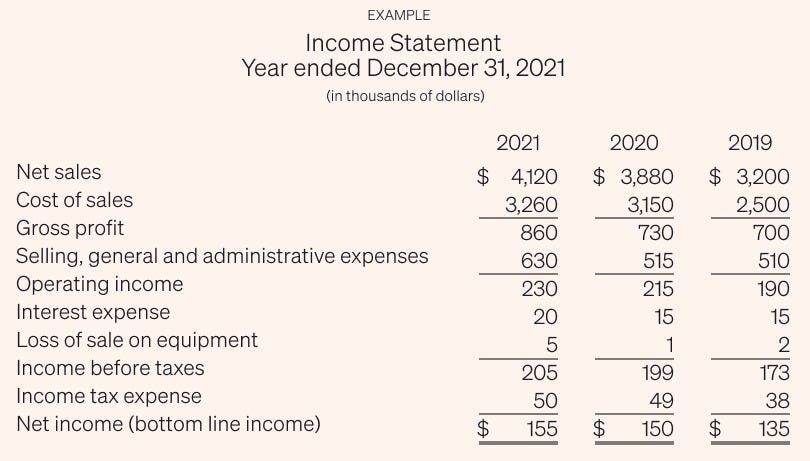
A standard* income statement will look like this:
*some companies does not provide gross profit. will go into details below
I will be using Old Dominion Freight line (ODFL) incomes statement below for discussion. All the numbers I refer below are for year 2024.
Revenue (or Sales)
For any company, it all starts with the Revenue (or Sales). It is all the money the company has made by selling their product and/or services.
Below is ODFL’s income statement. The topline shows all the revenue they made offering their services which is $5.8B.

Few companies who have revenues from various offerings provide details on the distribution of the revenue from various sources. Here is ODFL’s:

Cost Of Goods Sold (COGS)
This is all the costs the company incurred to produce its products/services. As I mentioned above not all companies clearly provide what is the Cost of Goods sold. But we can use resources like Finchat.io or Yahoo to get this information or we can do a quick calculation ourselves using income statement.
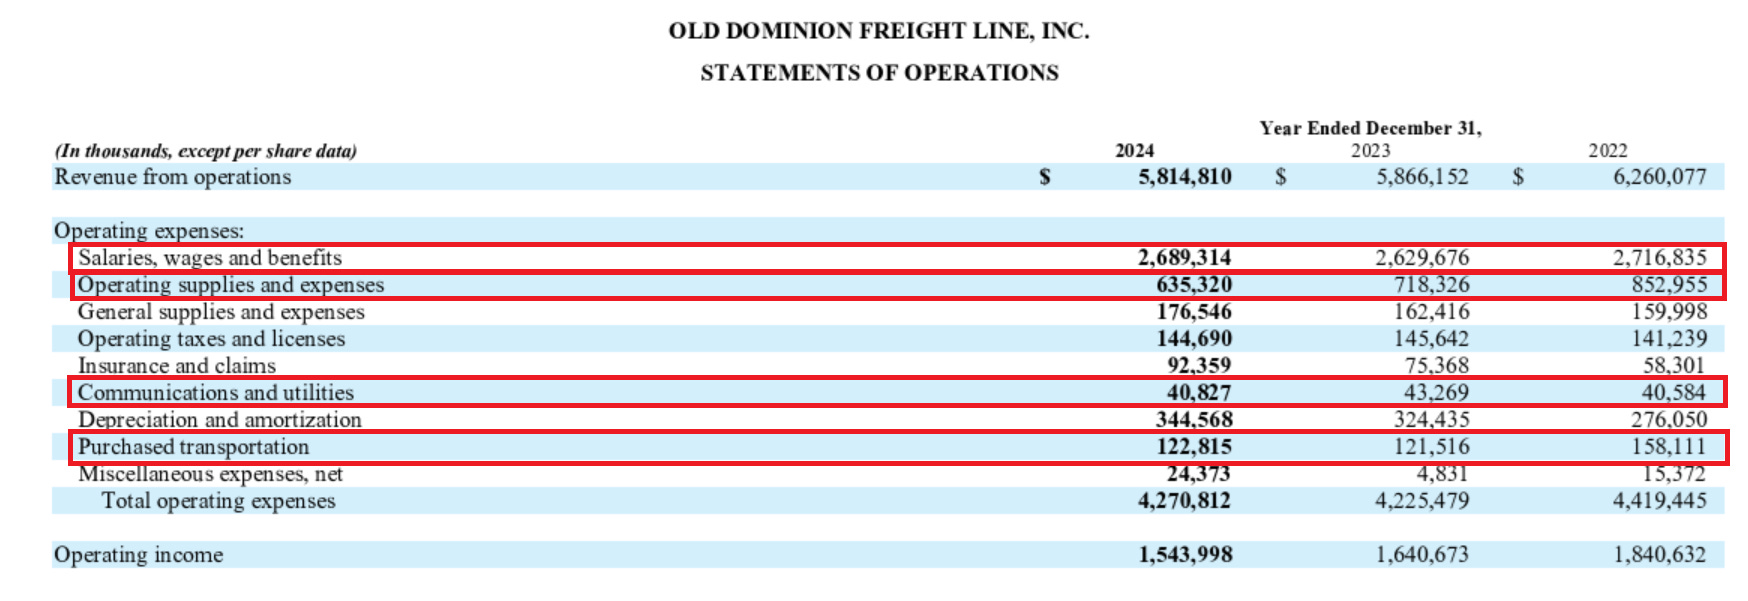
All the line items highlighted are the part of COGS. Adding those line items gives us a COGS of $3,488.3M
Gross Profit
Gross profit = Revenue - COGS
For ODFL: Gross profit = $5,814.8M - $3,488.3M = $2,326.5 M
Gross Margin:
Gross margin = Gross profit / Revenue
Gross Margin (ODFL) : $2,326.5M/$5,814.8M = 40%
40% Gross Margin for ODFL’s industry is great! Higher the margin’s the better
Operating Exense (OPEX)
Operating expenses are the costs a business incurs to run its day-to-day operations. They are also known as working or revenue expenses.
Operating expenses reflect the operational activities, not the investing or financing activities of a company.
Main Operating expenses fall under:
Selling General & Administrative (includes R&D)
Depreciation & Amortization
Rent & Utilities
Sales & Marketing
For ODFL, Operating expenses is basically taking the “Total Operating Expense” and subtracting all the COGS we calculated above.
OPEX = $4,270.8 - $3,488.2= $782.6M

Operating Income & Margin
Operating Income is taking the total revenues and decuct COGS & OPEX
Operating Income = Revenue-COGS-OPEX
For ODFL the Operating Income is $1,543M
Operating Margin = Operating Income/Revenue
Operating Margin= $1,543.9/5,814.8 = 26.5%

Non-operating income and expenses
Income and Expenses that are not related to the core business activities of the company. They are :
Interest Income/Expense
Financial securities Income/expense
Other Income/expense
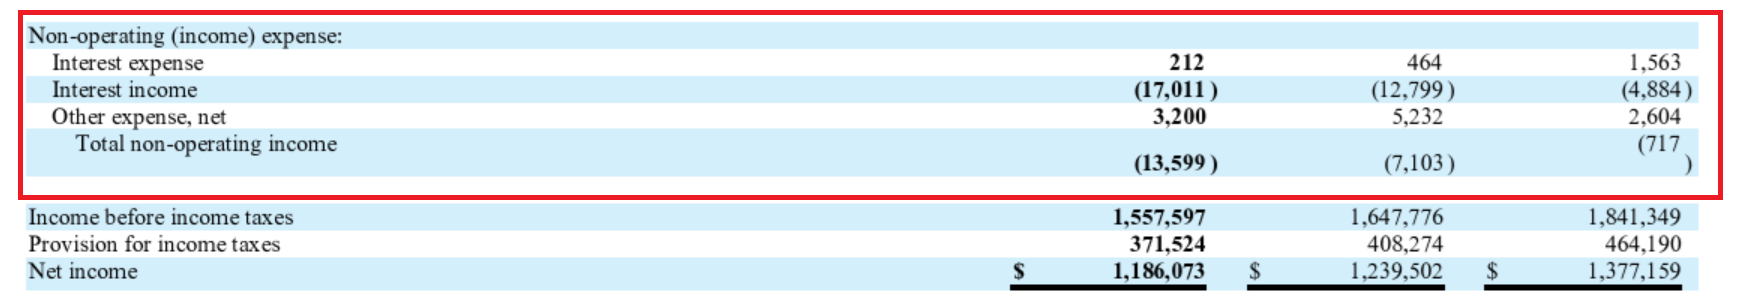
For ODFL, the total non-operating income is -$13.6M (it is ($13,599) number in the screenshot above).
Income before taxes (or Earnings before Tax- EBT)
EBT shows how much profit the company has made before paying its taxes.
Income before taxes = Operating income - Non-operating income and expenses
For ODFL, EBT= $1,542,998-13,599= $1,557.6M

Income tax Expense
These are the taxes the company have to pay to federal & state governments
For ODFL, it is $371.5 M
Net Income & Profit Margin
Net Income , also known as Bottom Line, earnings or profit, shows how much the company has made after substracting all the costs (including taxes)
Higher the number, better the company and looking the trend, we expect to see going up YOY.
Net income = Income before taxes - Taxes
For ODFL, Net Income = $1,186M

Profit Margin= Netincome/Revenue
For ODFL= $1,186M/$5,814.9M = 20.3%
Things to look for: Higher profit margins & growth overtime
Earnings per share (EPS)
This is one of the important metrics for an investor as EPS provides a view into the valuation of the company by comparing the current stock price with the latest EPS provided by the company.
Earnings per share = Earnings / Outstanding shares*
*When you see Income statement, you typically see companies show Basic & Diluted outstanding shares. What is the difference?
Basic Shares vs Fully Diluted Shares
Basic Shares are preferred shares that include the stock held by all the shareholders. Meanwhile, fully-diluted shares refer to the total number of shares that would be outstanding if all the convertible securities of a company were exercised.
Investors often focus more on diluted EPS as it provides a more conservative view of earnings per share by considering potential dilution from options, warrants, or convertible securities.

For ODFL, The EPS Diluted is $5.48 which is divinding the Net Income of $1,186 M by Diluted shares outstanding which is 216.5M
Earnings per share of a company will allow an investor to take a look at valuation by comparing the currenet stock price with its EPS.
To learn more about PE Ratio and valuation please read my post of PE Ratio explained
What is PE value for ODFL?
P/E ratio = Stock price / earnings per share
Current stock prive is $175 anad EPS os $5.48
PE = $175/$5.48= 32X
The lower, the P/E ratio, the cheaper the stock.
Learn more about valuation here: everything you need to know about valuation.
That’s it for today! Next posts I will talk about Cash flow and Balance Sheet statements
Conclusion:
Are Revenues and Gross Margins consistant and increasing
Is company profitable and increasing the Profit margins overtime
Are the number of shares outstanding consistant and not increasing
About Me:
I am a self-taught investor who has read hundreds of books on investing and spends 40+ hours a week researching and analyzing stocks.
I did not come from a finance background, and it took me nearly 10 years from first learning about the stock market to finally making my first investment. Since tracking my performance, I have achieved a 40% compound annual growth rate (CAGR).
I created this platform to share my investing journey and help others navigate the stock market with confidence.
Let’s grow together. 🚀
Visit my page to see access previous posts.
Disclaimer: This post is for educational purposes only and should not be considered financial advice. Always do your research before making investment decisions.